News & Blog
CIL5: The impact of CIL on Brownfield v Greenfield sites
Posted on February 27, 2013
In this blog we pick up some earlier themes and discuss the effect of taxation on the timing and rate of redevelopment.
As we have learned, CIL has its roots in the perceived windfall profit arising from the release of greenfield land by the planning system to accommodate new residential sites and urban extensions. However, lessons from previous attempts to tax betterment show that this is particularly difficult to achieve effectively without stymieing development. It is even harder to apply the concept to brownfield regeneration schemes with all attendant costs and risks. The difference between greenfield and brownfield scheme economics is important to understand for CIL rate setting.
Brownfield regeneration
The timing of redevelopment and regeneration of brownfield land particularly is determined by the relationship between the value of the site in its current [low value] use (“existing use value”) and the value of the site in its redeveloped [higher value] use (“alternative use value”) – less the costs of redevelopment. Any tax or levy which impacts on these costs will have an effect on the timing of redevelopment.
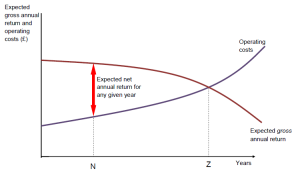
Figure 1 below shows the life of a building (from Urban Land Economics, Jack Harvey (3rd edition, 1992)). The brown line is the Expected Gross Annual Return or Rent. This goes down as the building becomes older and less appealing – and new Grade A buildings come onto the market etc.
Figure 1
The blue line is the Operating Costs of the building which go up as the building starts to deteriorate physically; it costs more to run in terms of energy efficiency etc; more expenses for repairs and maintenance; and it becomes less adaptable to modern technical requirements etc.
The red arrow on the graph is the Net Annual Return for any given year in the life of a building – it is the difference between the Gross Annual Return and the Operating Costs.
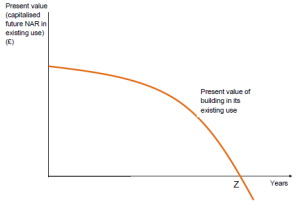
Figure 2 below shows the net difference from Figure 1. I.e. it is a graph of the diminishing returns illustrated by the red arrow on Figure 1.
Figure 2
This is the Present Value of the Net Annual Returns over time and it is important in analysing the timing an rate of redevelopment (see Figure 3 below).
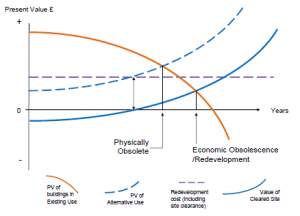
Figure 3 is derived from figures 1 and 2 and illustrates the timing of redevelopment in a brownfield land context.
Figure 3
In figure 3 the brown line is the same as on figure 2 i.e. the Present Value of the existing use of the property.
The horizontal purple dotted line represents the cost of demolishing the existing building, plus the cost of building a new building on the same site (including ‘normal’ profit for the developer). For simplicity’s sake it is assumed that these remain constant over time.
The blue dotted curve represents the value of the next alternative use which rises over time due to demand. Where this blue dotted line crosses the brown line the building is physically obsolete and redevelopment would occur, but the scheme has to carry the costs of demolition and rebuilding.
The solid blue line represents the alternative use value less the redevelopment costs (purple dotted line). As you can see this pushes out in time the point of redevelopment. This is economic obsolescence.
This is fundamental for the viability and redevelopment of brownfield sites. You can see that any tariff, tax or planning obligation which increases the costs of redevelopment (so pushes the purple dotted line upwards) – simply extends the timescale to redevelopment.
Greenfield Windfall Sites
This is quite different in the context of greenfield windfall sites. Greenfield sites are constrained by the planning designation. Once this is released for development there is a ‘windfall’ shift in the alternative use value – which makes the development economics more accommodating. There is much more scope to capture development gain without postponing the timing of development.
That said, there are some other important considerations to take into account when assessing the viability of greenfield sites. A good discussion of this is contained in the Harman Report, Viability Testing Local Plans, Local Housing Delivery Group, June 2012 pp29-31.
The existing use value may be only very modest (say, £5,000-£10,000 per acre) for agricultural use and on the face of it the landowner stands to make a substantial windfall to residential land values (say, £250,000+ per acre). However, there will be a lower threshold (“threshold land value”) where the land owner will simply not sell. This is particularly the case where a landowner ‘is potentially making a once in a lifetime decision over whether to sell an asset that may have been in the family, trust or institution’s ownership for many generations.’ (Harman, p30). Accordingly, the ‘windfall’ over the existing use value will have to be a sufficient incentive to release the land and forgo the future investment returns.
Another very important consideration is the role of the strategic land companies. Those carrying out economic viability assessments need to be very clear about the scope of the appraisal in a greenfield context. For example, in larger scale urban extension sites there will be significant investment in time and resources required to promote these sites through the development plan process. The threshold land value therefore needs to take into account of the often substantial planning promotion costs, option fees etc and the return required by the promoters of such sites. ‘This should be borne in mind when considering the [threshold] land value adopted for large sites and, in turn, the risks to delivery of adopting too low a [threshold] that does not adequately and reasonably reflect the economics of site promotion…’ (Harman, p31).
Summary
This difference between the economics of greenfield windfall sites and the ‘slow-burn’ redevelopment of brownfield sites is fundamental to the success of any regime to capture development gain such as CIL. Careful consideration does have to be given therefore to the physical nature of the Local Authority area (and/or charging zones) as the approach may be different for primarily rural Authorities promoting particular urban extensions compared to, say, urban metropolitan areas.


